Turnover report
The turnover report shows who joined, who left, and what that means as a rate. Use it to spot a rising exit rate early, see which departments lose people, and answer the board question of what your turnover actually is.
Where: My Team › Tools & Reports › Turnover
You need: the Reports (team) right 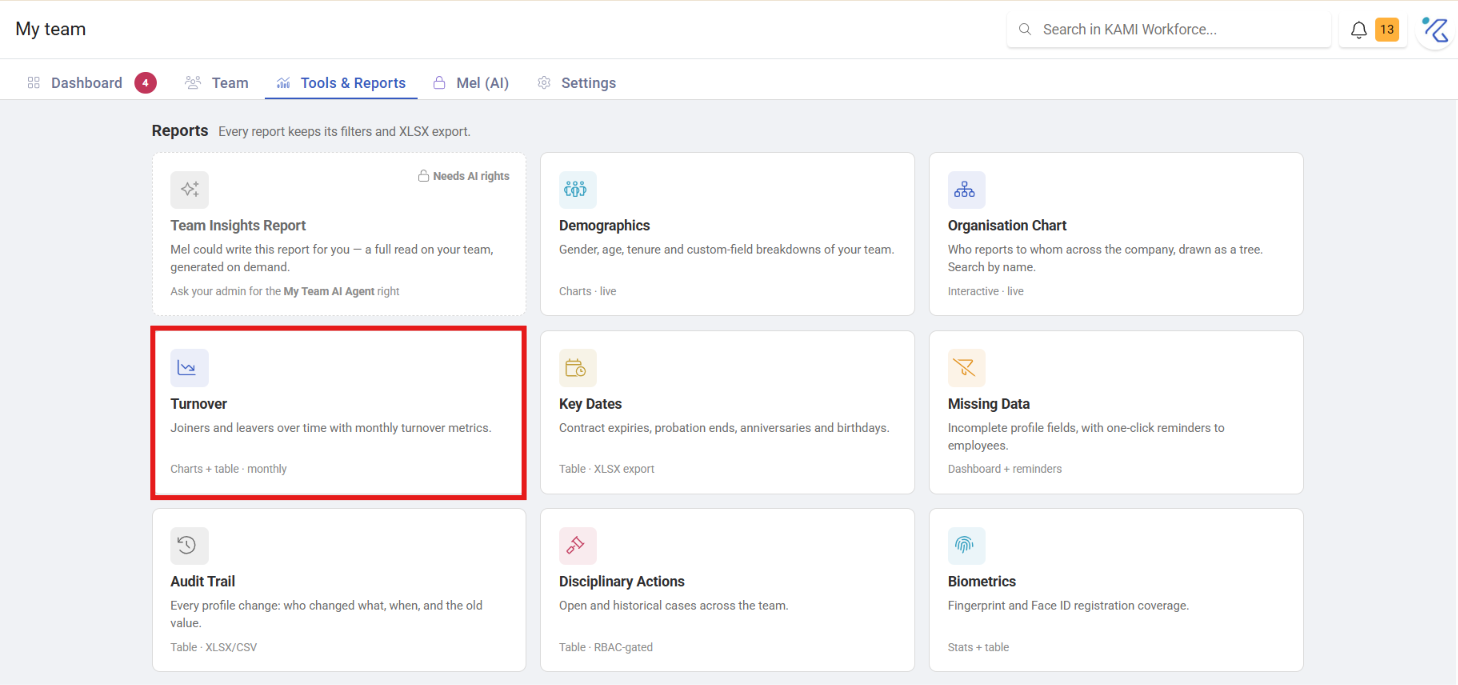
Before You Start
Turnover is only as good as your leaver data, and two things decide the numbers before you read them:
- A separation needs a last day recorded, or the person is not counted as having left.
- A separation needs a separation type so it lands in voluntary or involuntary. Exits recorded without one appear as Not classified — see Deactivating, terminating and rehiring employees.
Choosing a period
Look at the last month, last 6 months or last 12 months, and narrow by subsidiary, branch, department, position and separation type.
Twelve months is the figure to quote externally. Shorter windows swing wildly in a small company, where one or two departures move the rate by several points.
The summary cards
| Card | What it means |
|---|---|
| Headcount | Active employees at the end of the period |
| Joiners | People who started during the period |
| Leavers | Everyone who left, whatever the reason |
| Voluntary | Resignations and other employee-initiated exits |
| Involuntary | Company-initiated exits |
| Turnover rate | Leavers as a percentage of average headcount |
| Annualised rate | That rate projected to a full year |
Why voluntary and involuntary may not add up
The question this report generates most, and it is not a bug.
Unclassified separations belong to neither bucket. With 10 leavers, 6 voluntary and 2 involuntary, the missing 2 have no separation type recorded. They still count in the total and still affect your rate — they simply cannot be attributed.
If the numbers do not reconcile, you have unclassified separations, and the fix is to set a separation type on them.
Period rate versus annualised rate
They answer different questions and should not be used interchangeably:
- Period rate — actual turnover over the window selected. Over 3 months, that is your 3-month turnover.
- Annualised rate — the same rate projected across a year, so periods of different lengths compare.
Quote the annualised figure when benchmarking, and the period figure when reporting what actually happened.
How the rate is calculated
Leavers are divided by average active headcount over the period, not headcount on the final day.
This matters in a growing company: starting the year at 50 and ending at 100, dividing by 100 flatters the number and dividing by 50 exaggerates it. The average is the fair denominator.
End-of-contract exclusions
Your company can exclude end-of-contract separations from turnover — sensible where fixed-term contracts ending on schedule are normal business rather than attrition.
When that setting is on, the turnover card says so and reports how many separations were excluded. If your rate looks lower than expected, check this first: the leavers are still in the list, they are just outside the rate.
The monthly breakdown
Each month shows joiners, leavers, net change, closing headcount and that month's rate, so you can see whether a figure is a trend or one bad month.
One deliberate behaviour: the leavers count on a monthly row shows every separation that month, ignoring any separation-type filter you have applied. So a month can read "5 separations" and show none when expanded under a filter. That is intentional — it stops a filter hiding the fact that people left at all.
The leaver list
Every separation in the period, with department, subsidiary, branch and position, last day, hire date, tenure, separation type and — where termination pay was processed — the statutory reason.
Two fields are blank more often than people expect:
- Tenure is blank when either the hire date or last day is missing.
- Reason for termination is blank when no termination pay was processed. Its absence says nothing about why the person left.
What Happens Next
The report changes nothing. What it should produce is a question:
- Turnover climbing in one department → usually a manager or workload issue, not a company-wide one. The departmental filter tells you where to look.
- Short tenures → people leaving inside a year points at hiring or onboarding rather than retention.
- Lots of "Not classified" → your leaver data needs attention before the report can tell you anything about why people leave.
Tips
- Fix classification before analysing. A report with unclassified leavers cannot answer the only question worth asking.
- Read the 12-month rate for direction, the monthly breakdown for cause. The annual figure tells you whether there is a problem; the months tell you when it started.
- Compare departments, not companies. External benchmarks vary so much by sector and country that internal comparison is usually more informative.
- Export at the same point each quarter, so the series is consistent.