Demographics report
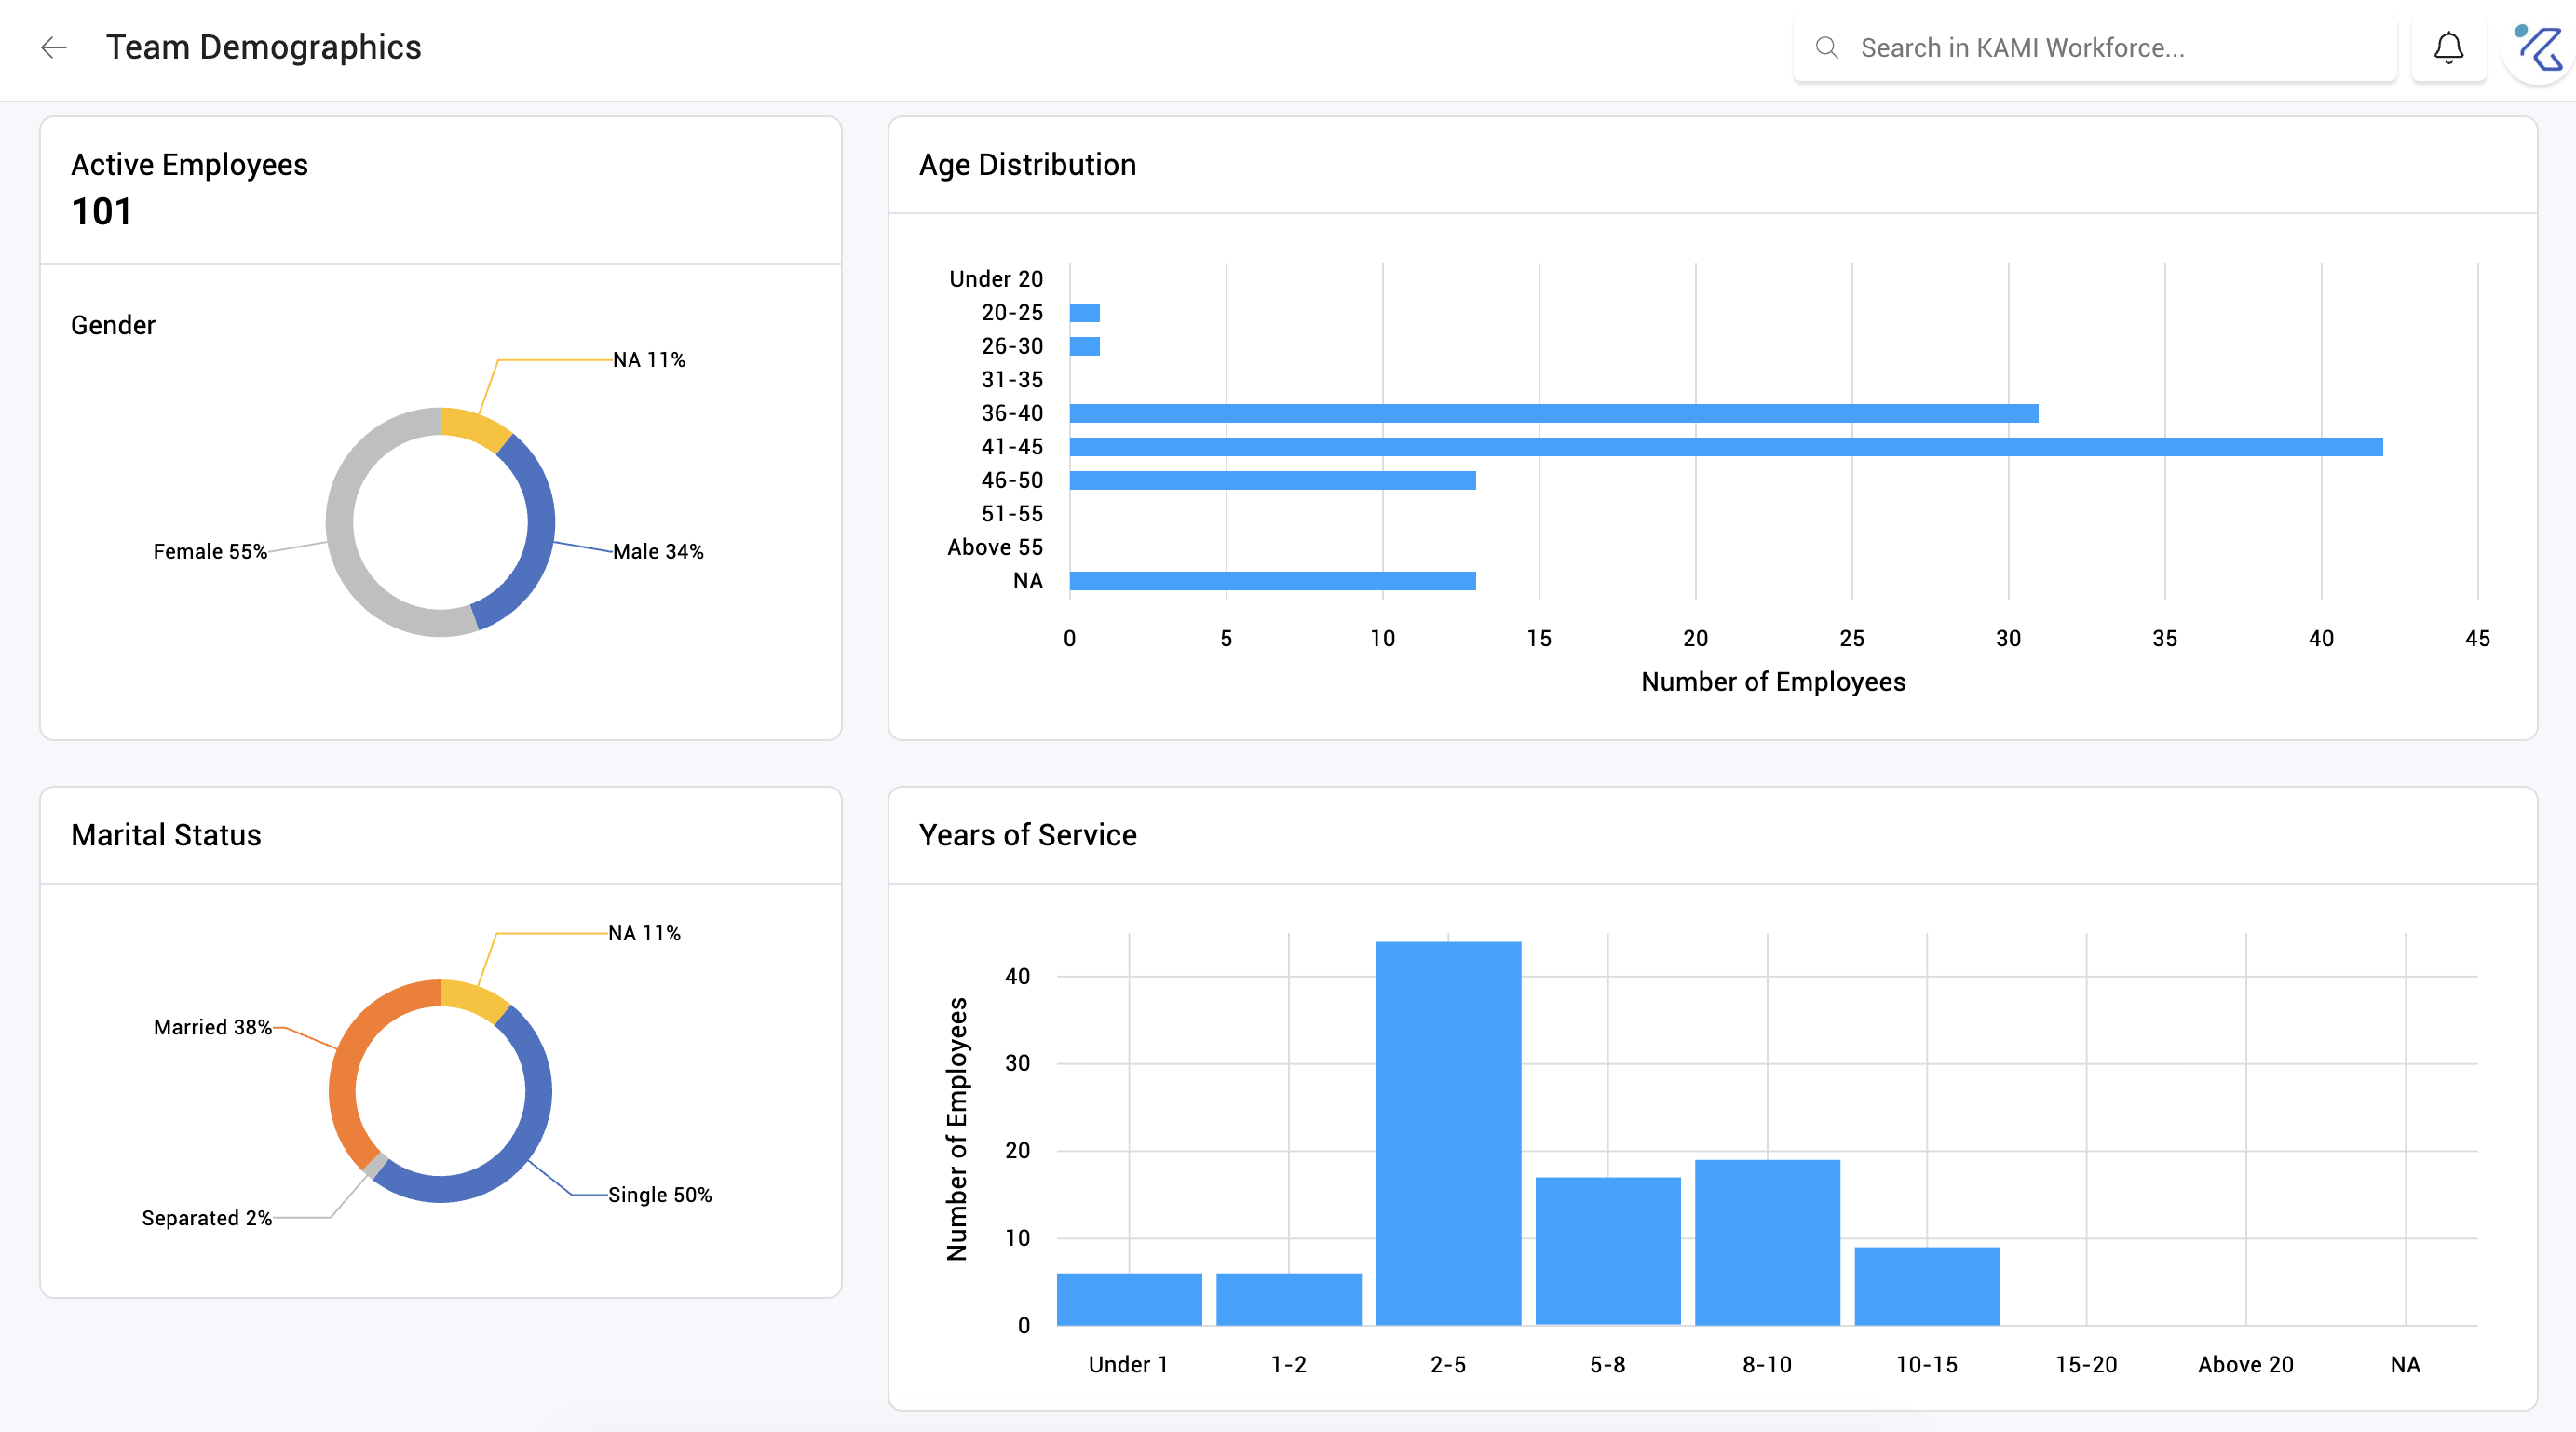
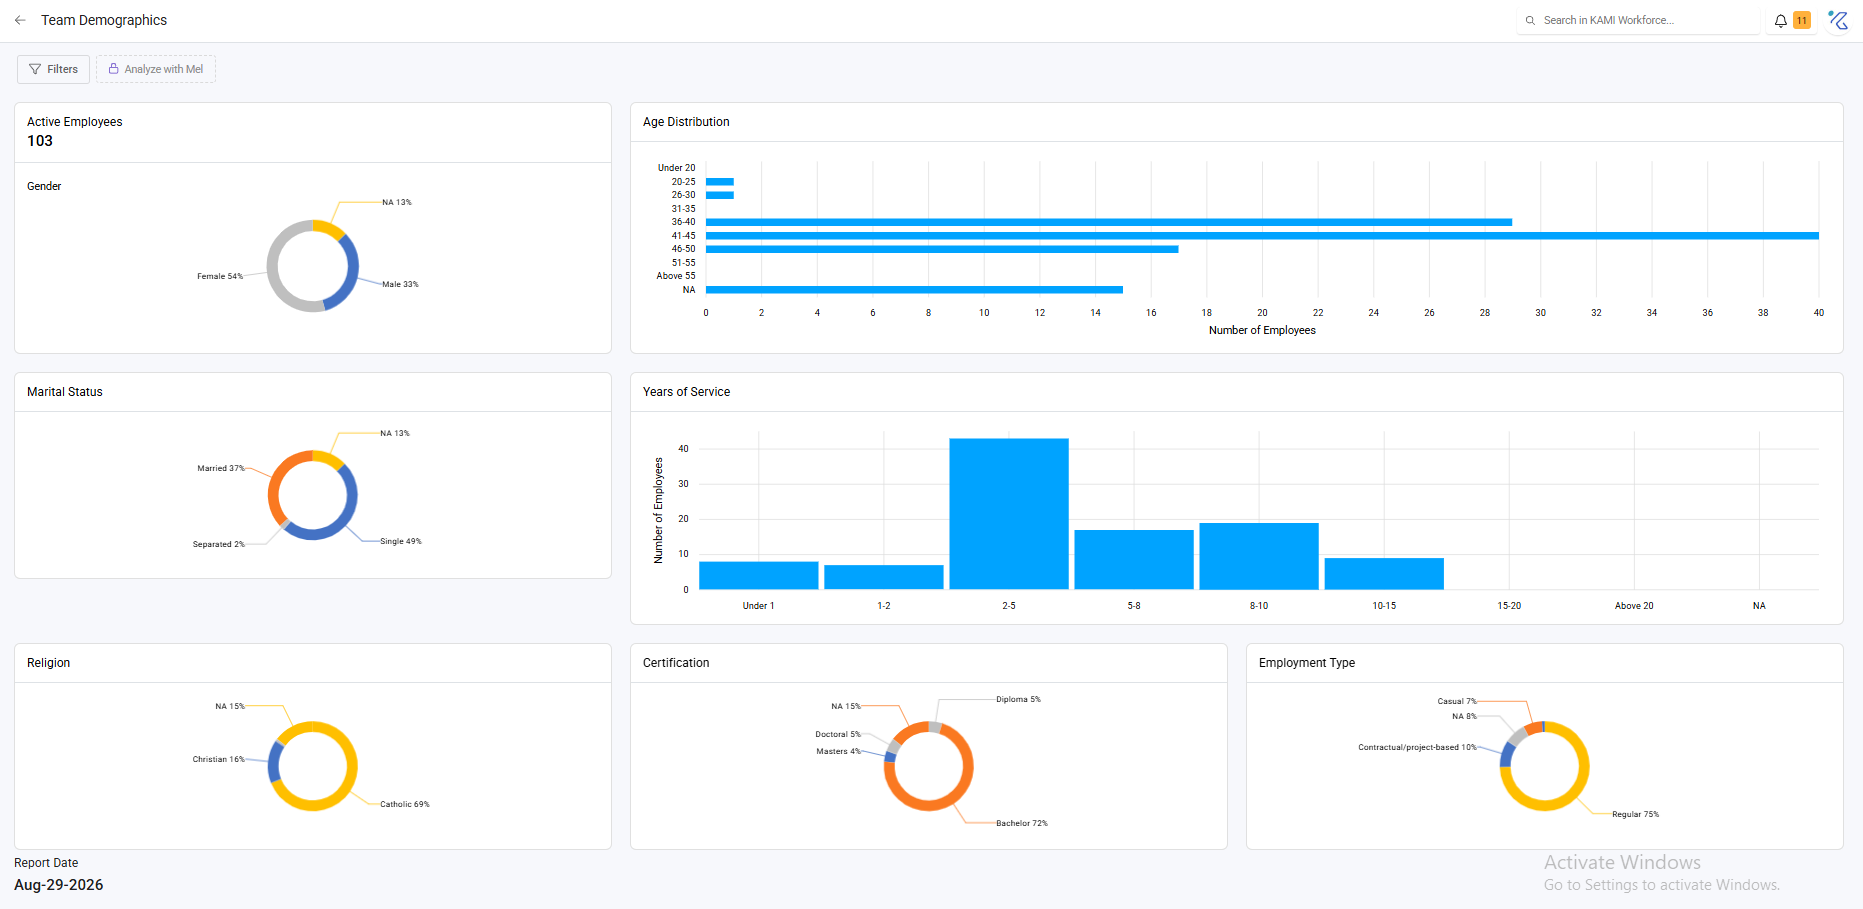
The Demographics report describes the shape of your workforce — how it splits by department, location, tenure, gender, age and your own custom fields. It is the report you open when someone asks a question about the organisation rather than about a person.
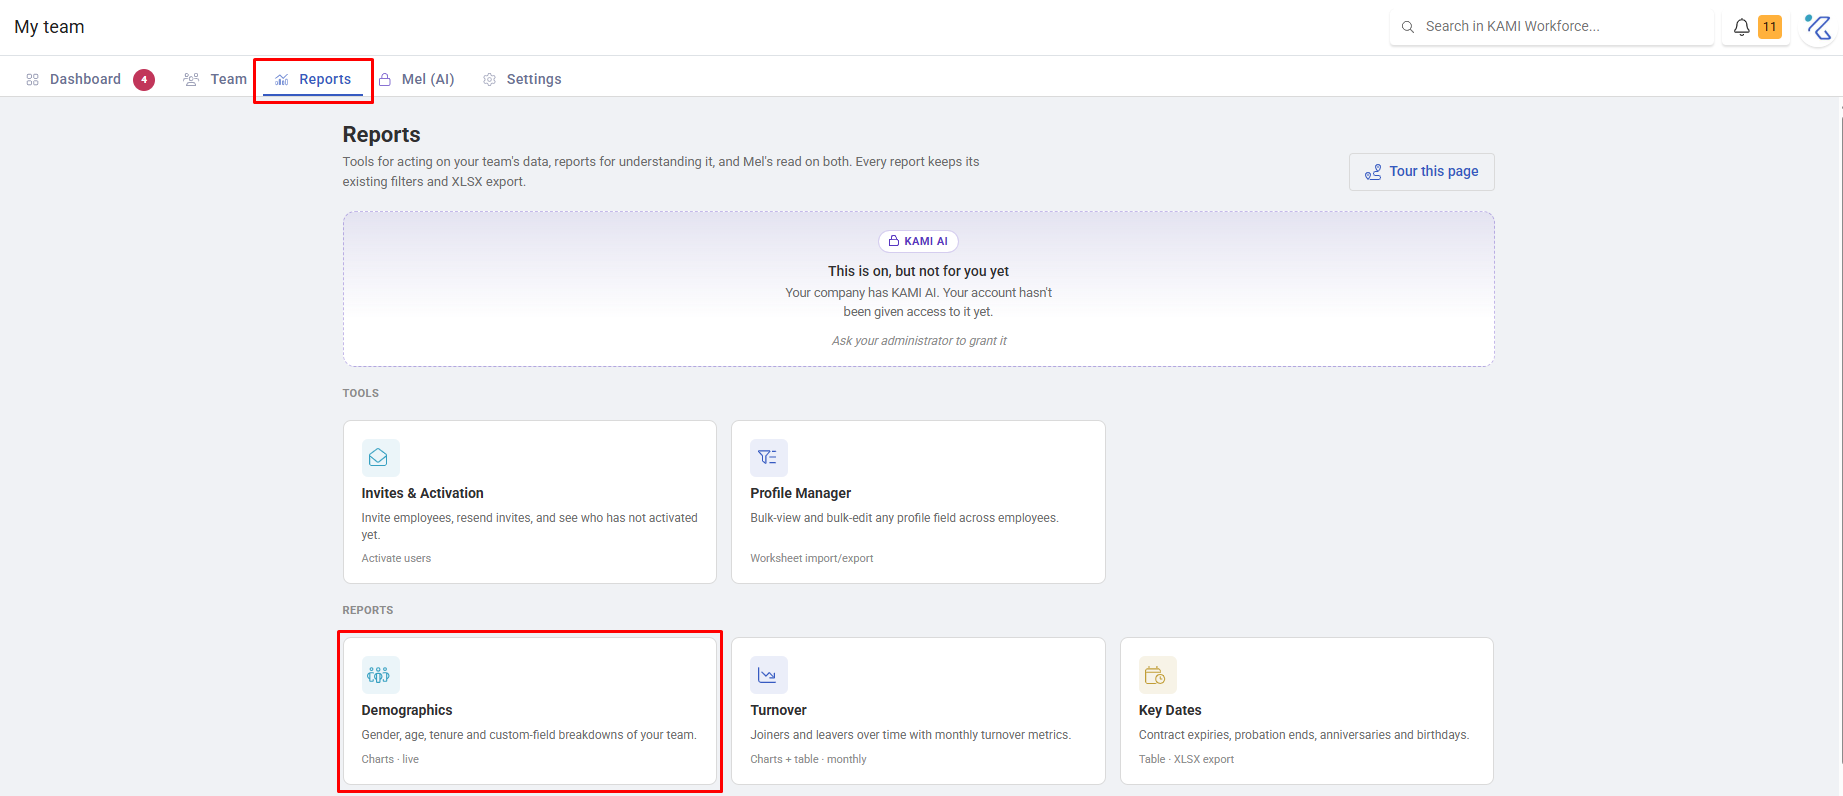
Where: My Team › Reports › Demographics
You need: the Reports (team) right
When to use this, and when not to
| The question | Use |
|---|---|
| What does our workforce look like? | Demographics |
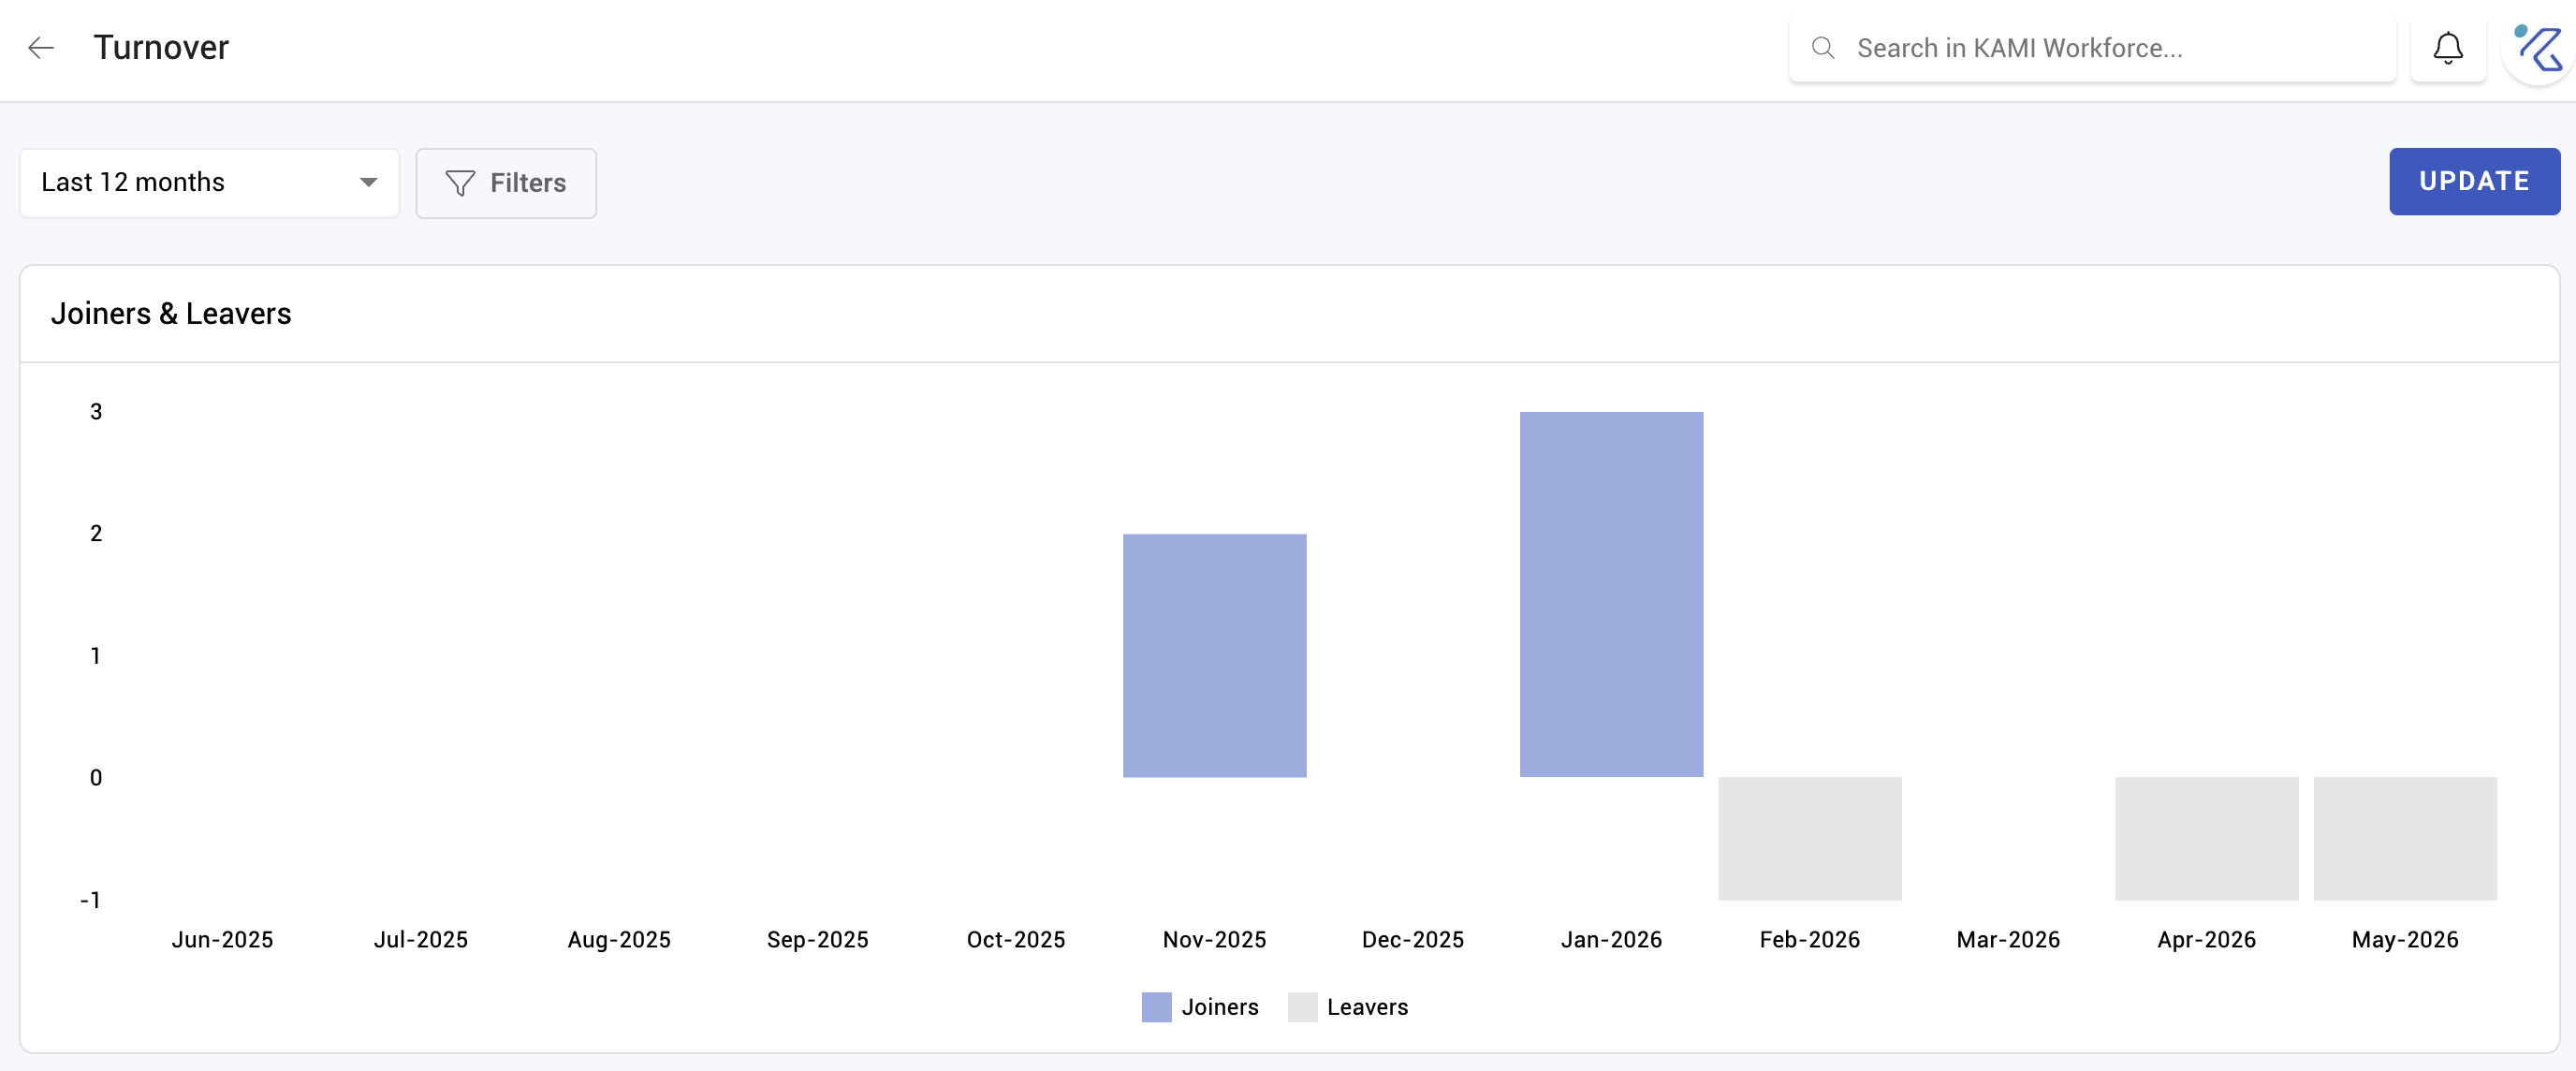
| Who is leaving, and why? | Turnover |
| What is coming up for people? | Key Dates |
| Is our data complete enough to trust this? | Missing Data |
What it shows
Headcount broken down across the dimensions you hold:
- Organisational — subsidiary, branch, department, position, cost centre, group
- Personal — gender, age band, tenure
- Your own custom fields, where your company has defined them
Filter to a subset and the breakdowns recalculate, so you can ask the same question of one department that you asked of the company.
What it is genuinely used for
Reporting obligations. Many jurisdictions require workforce composition reporting, and this is where the numbers come from.
Planning conversations. Tenure distribution tells you whether you are about to lose a lot of institutional knowledge; age bands tell you about succession; department splits tell you where growth has actually happened rather than where it was budgeted.
Checking that intent matches reality. Most organisations have beliefs about their own shape. This is the report that confirms or corrects them.
Reading it honestly
Every breakdown depends on the field being filled in. A gender or age breakdown across a workforce where a third of profiles lack the field is not a breakdown, it is a sample — and one selected by who happened to complete their profile, which is not random.
Check Missing Data before drawing conclusions, particularly for anything that leaves the building.
What Happens Next
The report is read-only. What it should produce:
- A gap between belief and data → usually the more interesting output than the numbers themselves
- Incomplete dimensions → a Missing Data exercise before the next reporting cycle
- A concentration you did not expect → a planning conversation, not a report
Tips
- Export with the date attached. Demographics change continuously; a figure without a date is unquotable six months later.
- Use the same filters each time you report externally, or your series is not comparable.
- Treat personal fields carefully. Gender and age data is sensitive, and how widely it is shared should be a deliberate decision rather than a default of the report's access rights.
- Look at tenure bands more than headcount. Headcount is known; the tenure distribution is where the surprises are.
Troubleshooting / FAQ
Q: A breakdown shows a large "unknown" or blank group. That field is not filled in for those employees. See Missing Data.
Q: The numbers do not match our payroll headcount. Check whether deactivated employees are included, and whether both are as at the same date.
Q: Our custom field is not appearing. Custom fields must be defined for the company before they can be reported on.
Screenshots
These screenshots came from our previous help centre and may show an earlier version of the interface.