Team Insights Report
Team Insights brings the headline measures of your workforce into one place — headcount, movement, and the indicators that suggest where to look next. It is the overview report: the one to read when you want a sense of how things are, rather than an answer to a specific question.
Where: My Team › Reports
You need: the Reports (team) right
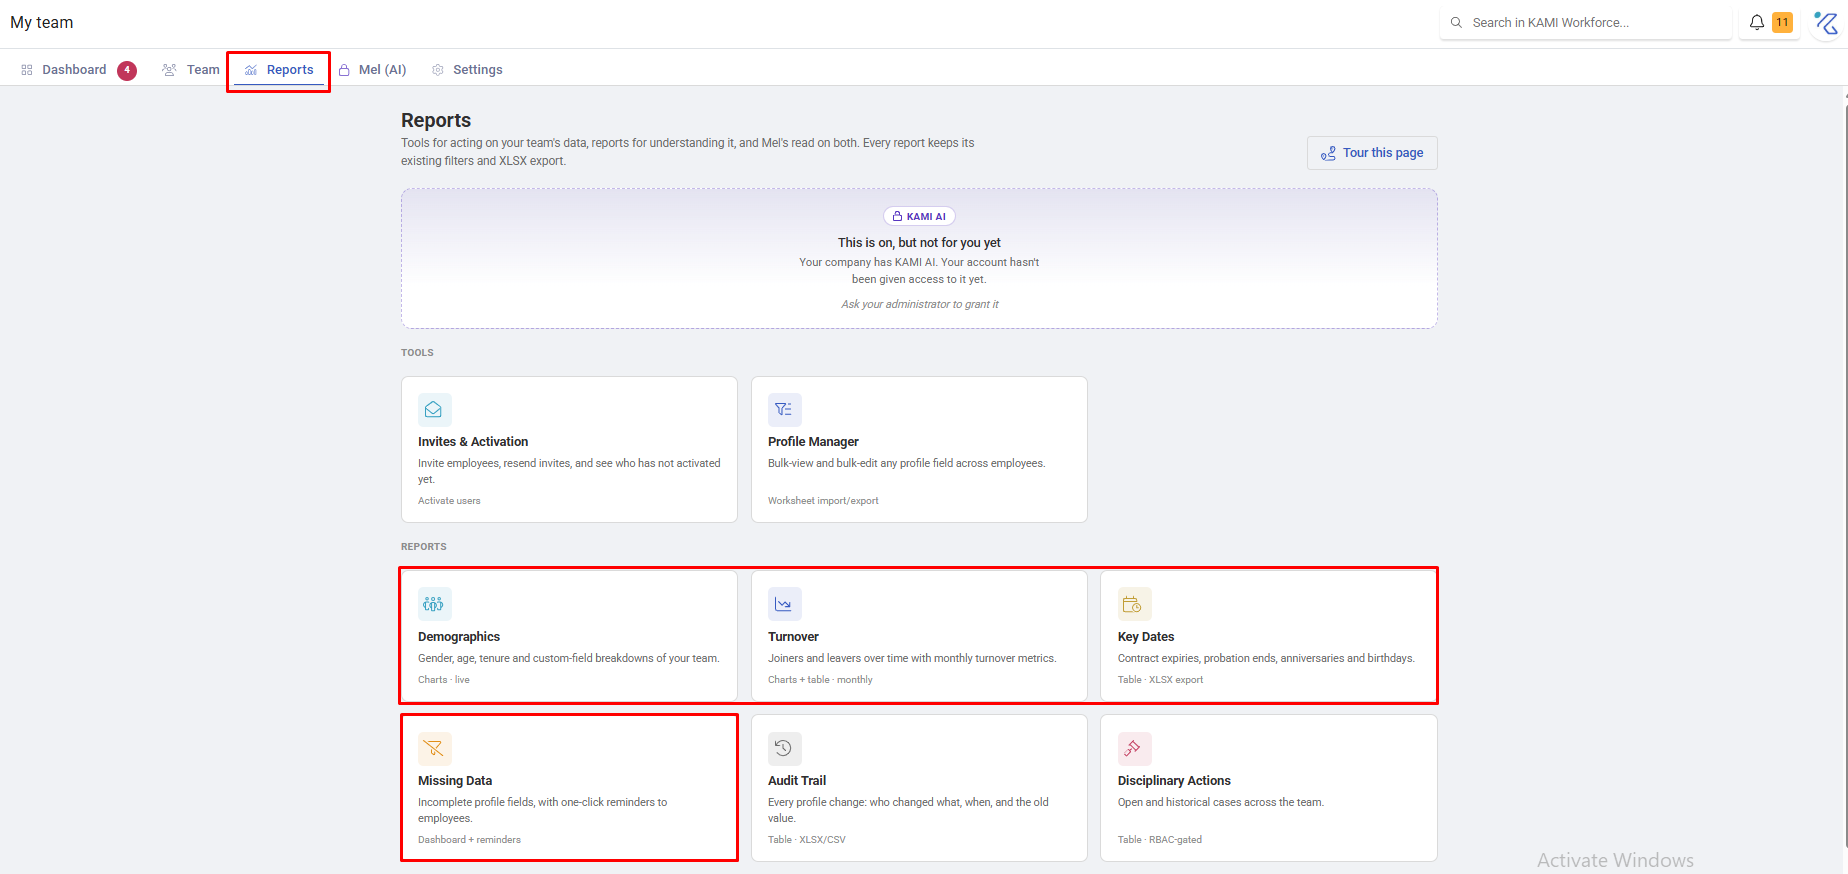
When to use this, and when not to
| The question | Use |
|---|---|
| How are things generally? | Team Insights |
| Who is leaving, and why? | Turnover |
| What is our shape? | Demographics |
| What is coming up? | Key Dates |
| Is our data trustworthy? | Missing Data |
Team Insights is deliberately broad. When something in it looks worth understanding, the specific report is where you go — this one tells you which question to ask.
What it shows
Headline measures across your team or company, filterable by the usual dimensions: headcount and how it is moving, joiners and leavers, and the composition indicators that suggest where attention is needed.
Filter to a department and the same measures recalculate, which is how you find out whether a company-level pattern is everywhere or one team.
What Happens Next
The report changes nothing; it points somewhere:
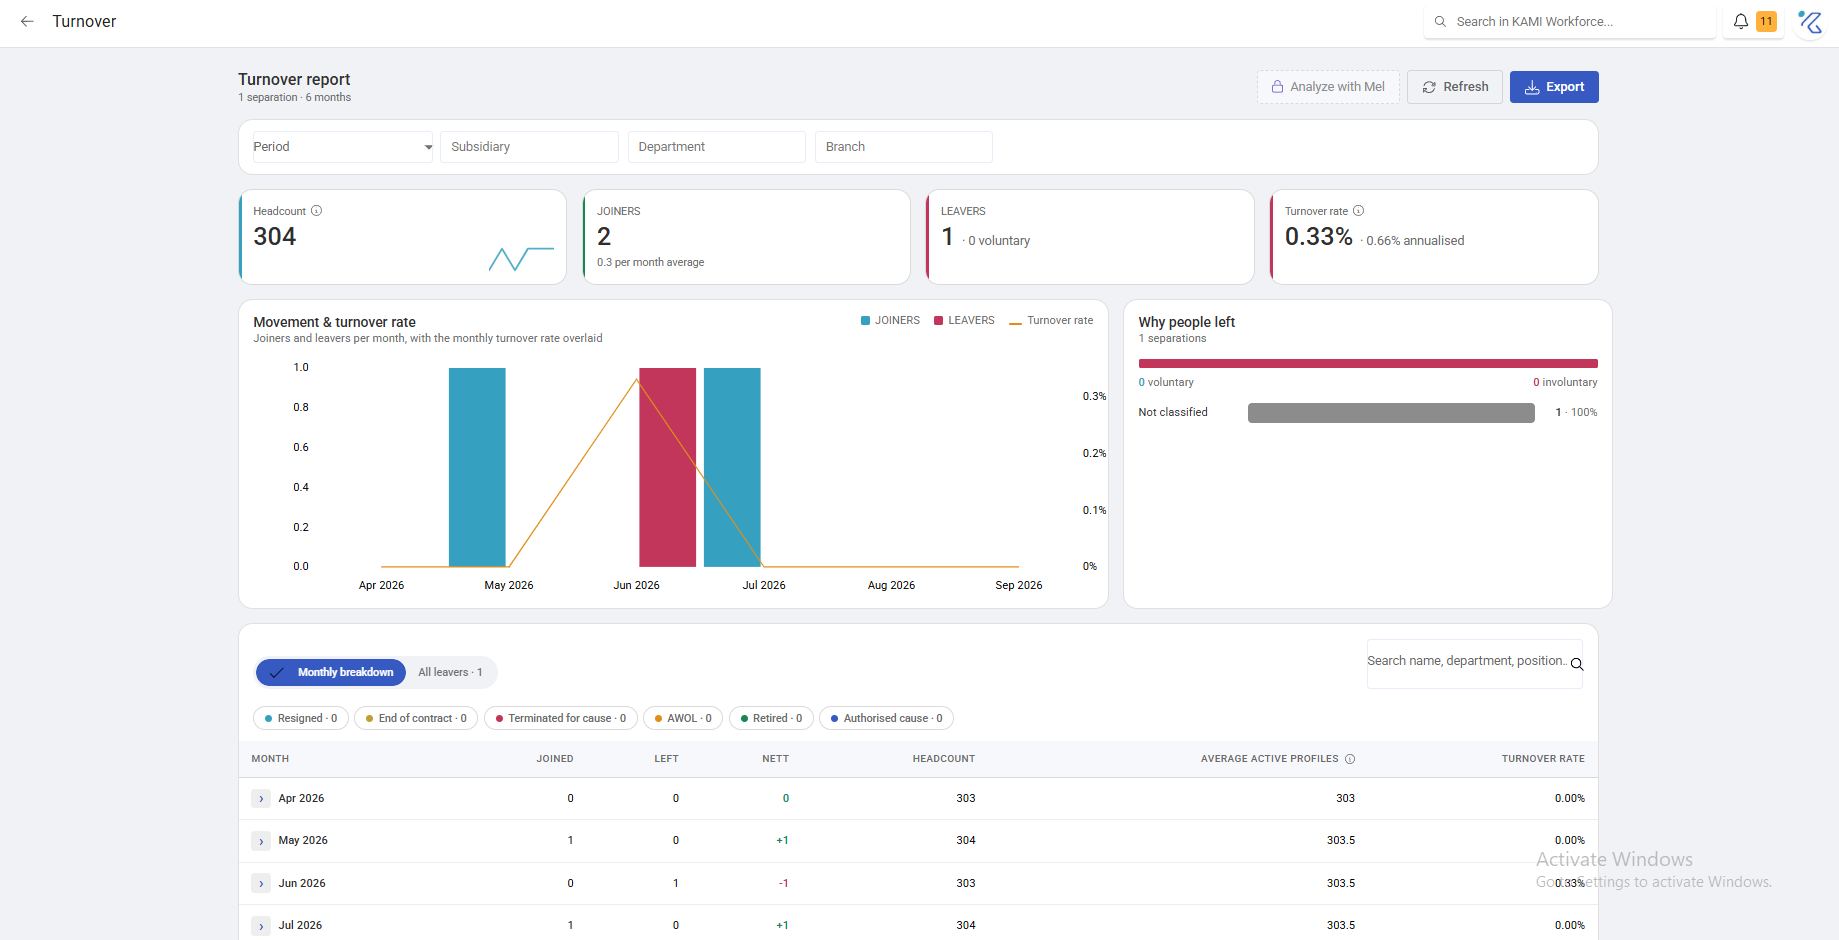
- Headcount moving unexpectedly → Turnover for the leavers, and whether they are classified
- A department that looks different from the rest → usually a real difference in work, occasionally a data-quality artefact
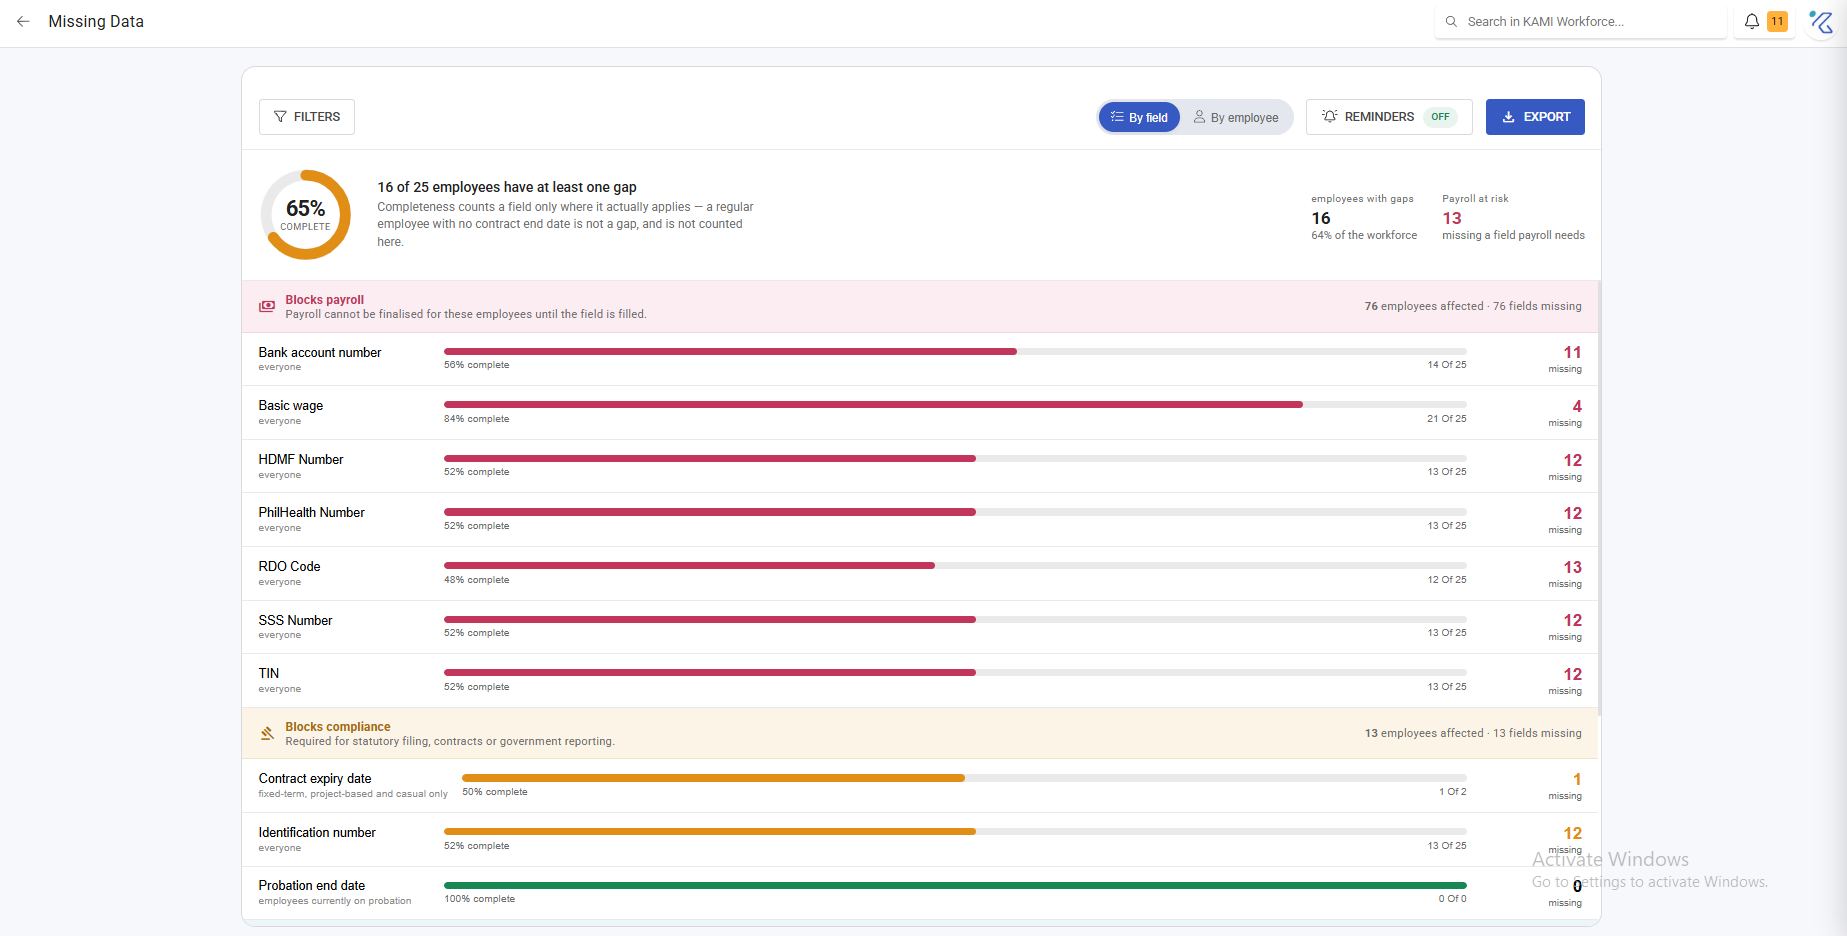
- Anything that looks too good → Missing Data, because incomplete records make most measures look better than reality
Reading it honestly
Every measure here inherits the completeness of the underlying records. Employees missing hire dates, placements or expected working hours are excluded from the calculations that need them — and their exclusion generally makes the numbers look tidier, not worse.
Read it alongside the Missing Data count, always. A workforce report calculated over 80% of your people is a sample, and one selected by who happened to be onboarded properly.
Tips
- Use it as a monthly starting point, not a monthly report. Its job is to send you somewhere specific.
- Compare periods, not absolutes. What counts as normal depends entirely on your organisation; movement is the signal.
- Filter to one department before drawing conclusions. Company-level figures average away exactly the problems worth finding.
- Do not circulate it without the specific reports behind it. A headline number without its cause invites the wrong conclusion, and headline workforce numbers travel further than their caveats.